Climate Action: Understanding Nelson's emissions profile
20/10/2021 5:47pm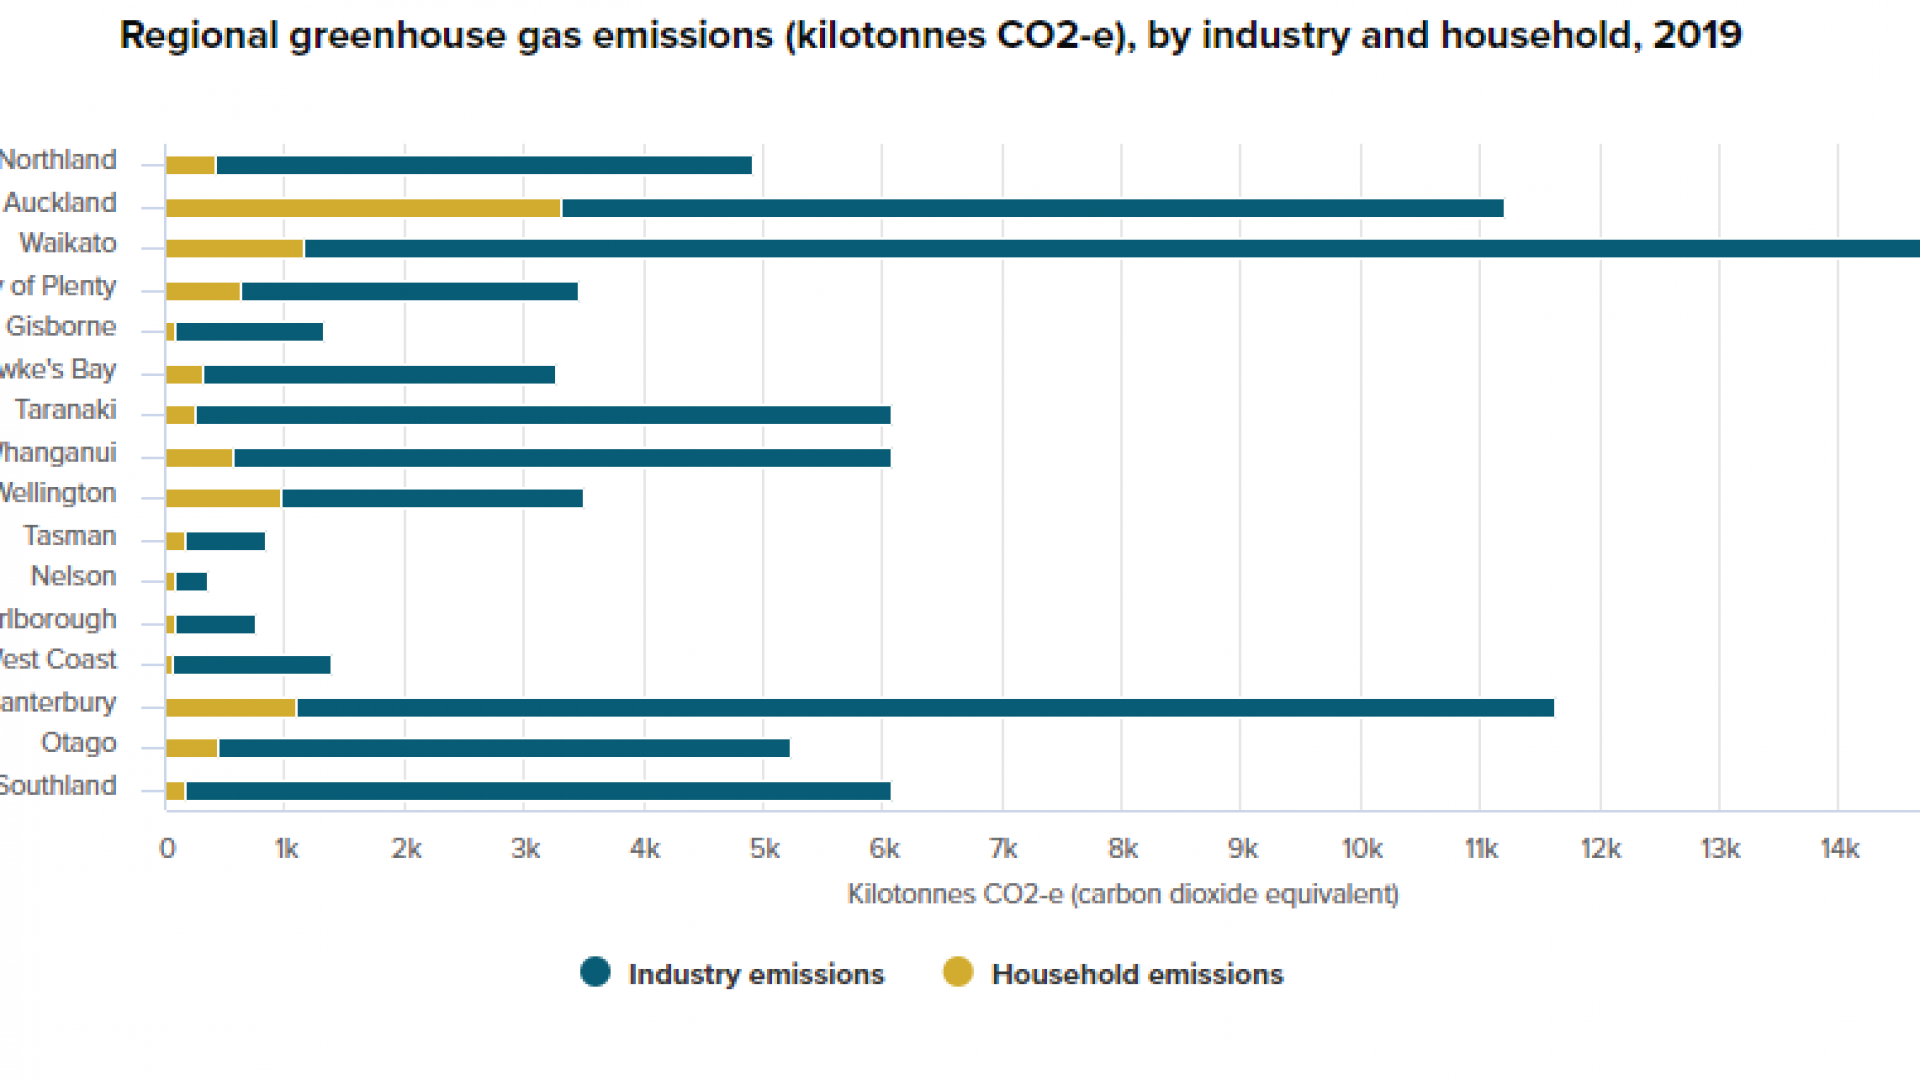
We publish a regular column called Climate Action, as part of an ongoing series on climate change. We invite voices from the community and other stakeholders, as well as talking about Council and Government initiatives and news.
The most up-to-date data from Statistics New Zealand (Stats NZ) separates Nelson household and industry greenhouse gas emissions (GHG) from neighbouring Tasman for the first time, allowing a greater understanding of our emissions profile.
Community and industry GHG emissions profiling has been provided by Stats NZ for the last two years. However, this data represented combined GHG emissions data for the Nelson and Tasman regions, making it challenging to understand Nelson’s emissions.
Nelson City Council (NCC), Tasman District Council (TDC) and Nelson Tasman Climate Forum (NTCF) made a combined submission to Stats NZ to request individual data, providing reasons of how valuable it is for both Nelson and Tasman councils to have individual GHG inventories for each community.
Previously bundled carbon footprint inventories showed, for example, that agriculture was the highest emission of the Tasman-Nelson community profile. The separated data confirms that the agricultural source of GHG emissions is attributable mainly to the Tasman region.
What we now have is valuable data to measure ourselves against as a starting point.
Nelson City Council is taking this data further by conducting additional work based on the Global Protocol for Community-Scale Greenhouse Gas Inventories; an international best standard of measurement that breaks down emissions into more detailed data subsets and presents a more detailed carbon footprint.
The next step will be to create a regional profile in conjunction with TDC, NTCF and NRDA. This will deepen our understanding of where we can, as a community, make a difference.
The good news is that the latest data published by Stats NZ, shows that Nelson’s total household GHG emissions for 2019 decreased by 18% compared with 2018, and that household transport emissions for 2019 decreased by 19%.
The data also shows that private transport is responsible for 90% of total household emissions. By comparison, heating and cooling only generates 7% of household emissions.
The high private transport emissions figure highlights the importance of the work Council has already been doing towards encouraging more sustainable forms of transport, like walking, cycling and public transport. These are the areas where small changes could really mean we reap the rewards in terms of lowering our emissions as a city.
More information about Nelson City Council’s climate action can be found at nelson.govt.nz/climate-change. To view the full Stats NZ report on GHG emissions by region (industry and household): Year ended 2019, go to stats.govt.nz/greenhouse-gas-emissions-by-region-industry-and-household-year-ended-2019


